Interactive Data Analysis
Users wanted to analyze data without knowing SQL, so we provided support for interactive analysis that became a highly adopted feature.
- Timeline
- December 2017 – May 2018
- Team
- UX Designer, PM, Engineering Lead
- Feature
- Data Discovery
Background
Periscope Data helps data teams answer critical questions, increasingly by opening data up to everyone. This project was a chance to empower salespeople, marketers and other business users, and to save analysts time by operationalizing their work.
The problem
Analysts hit an upper limit
Analysts could only build so many dashboards and ad-hoc analyses. Self-service for partner teams would free them for more advanced work.
Business users left the product
Without SQL, many downloaded CSVs into Excel or turned to competing tools to answer simple questions.
Research
Before kicking off, I ran remote user interviews to understand business users’ needs, how they work with data teams and IT, and how comfortable they are joining data. These findings shaped the PM’s requirements.
- As a business analyst, I want to play with relevant data to discover trends.
- As a business analyst, I want to build a dashboard for my team.
- As a data analyst, I want to be able to audit an interactive chart.
Many users already thought in drag and drop, so we focused on testing that interaction. I also researched BI tools to understand industry standards.
Wireframes, testing and visual design
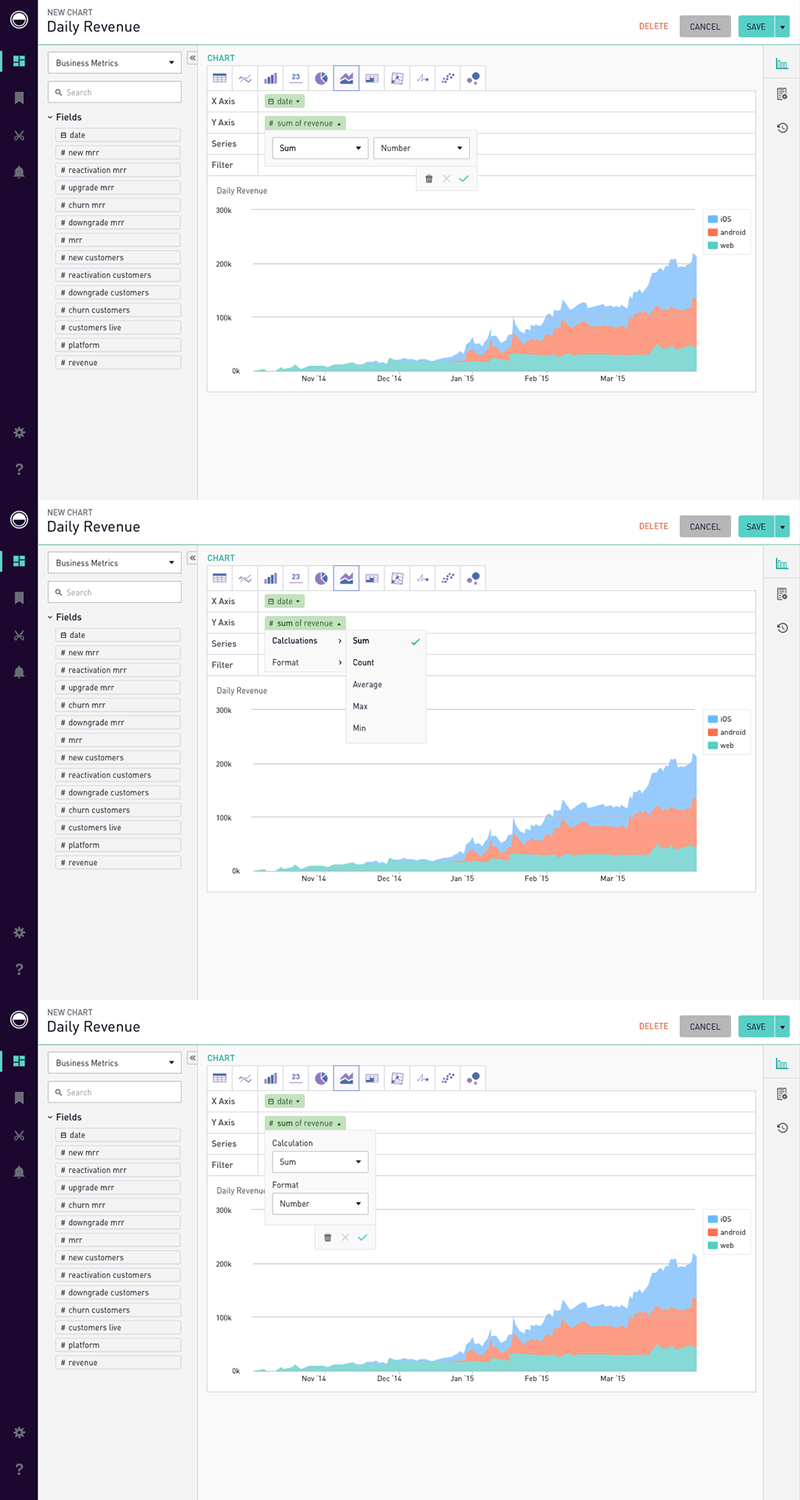
After rounds of user, stakeholder and engineering reviews, I wireframed for usability testing, exploring:
- How users think about creating an analysis
- Auditing an interactive chart
- Charts of mixed origin
- Aggregation, filtering and limits
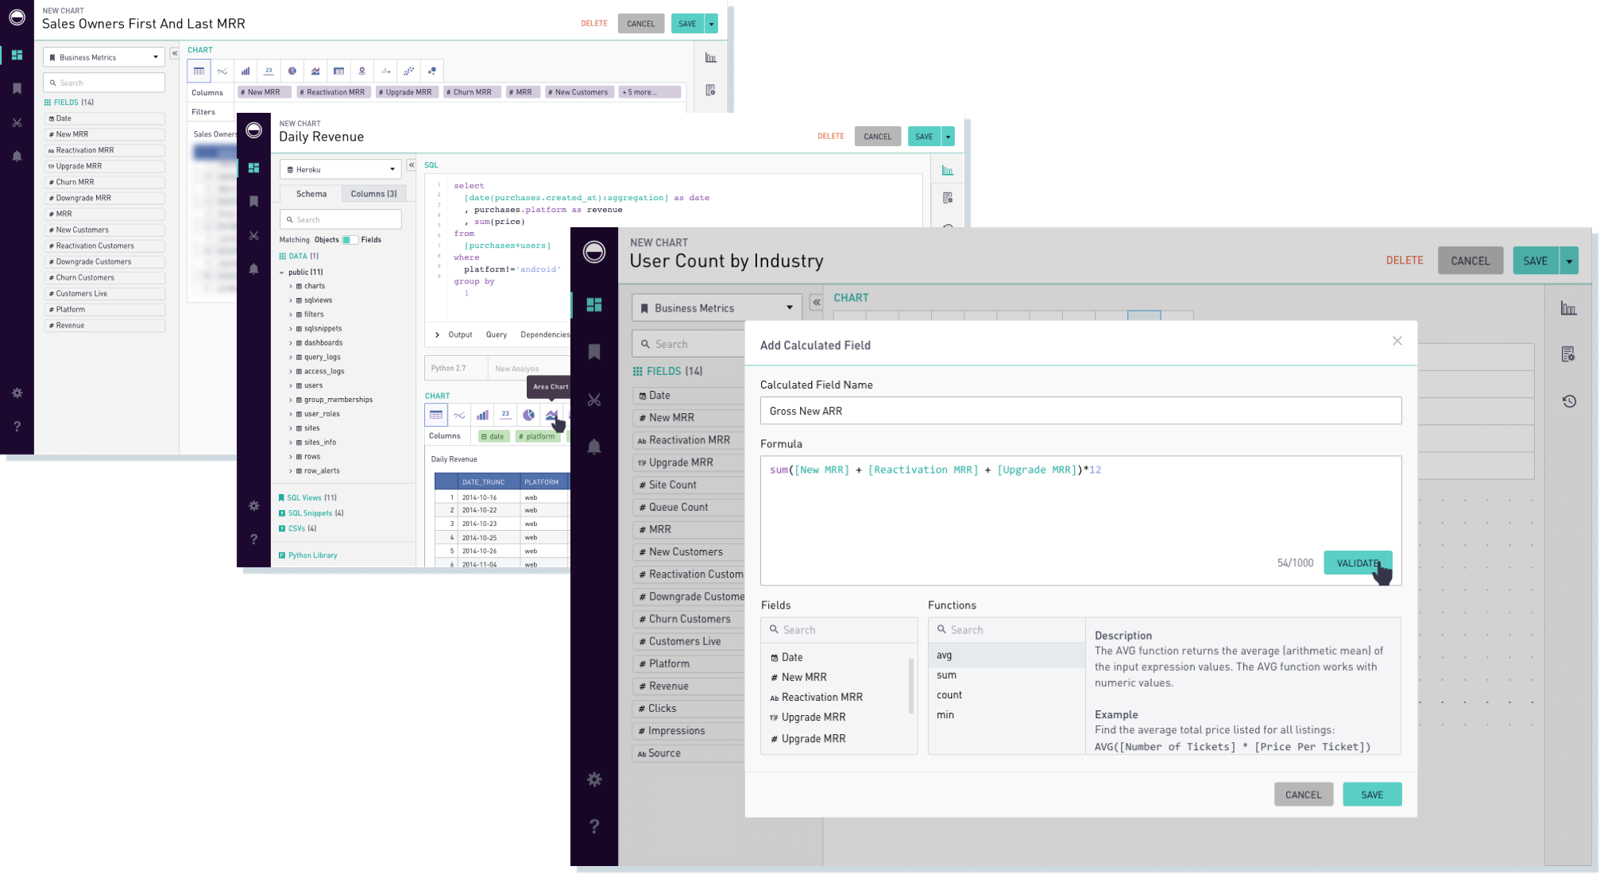
Once the direction was approved, I designed the visuals, building on our existing visual language.
Interactions
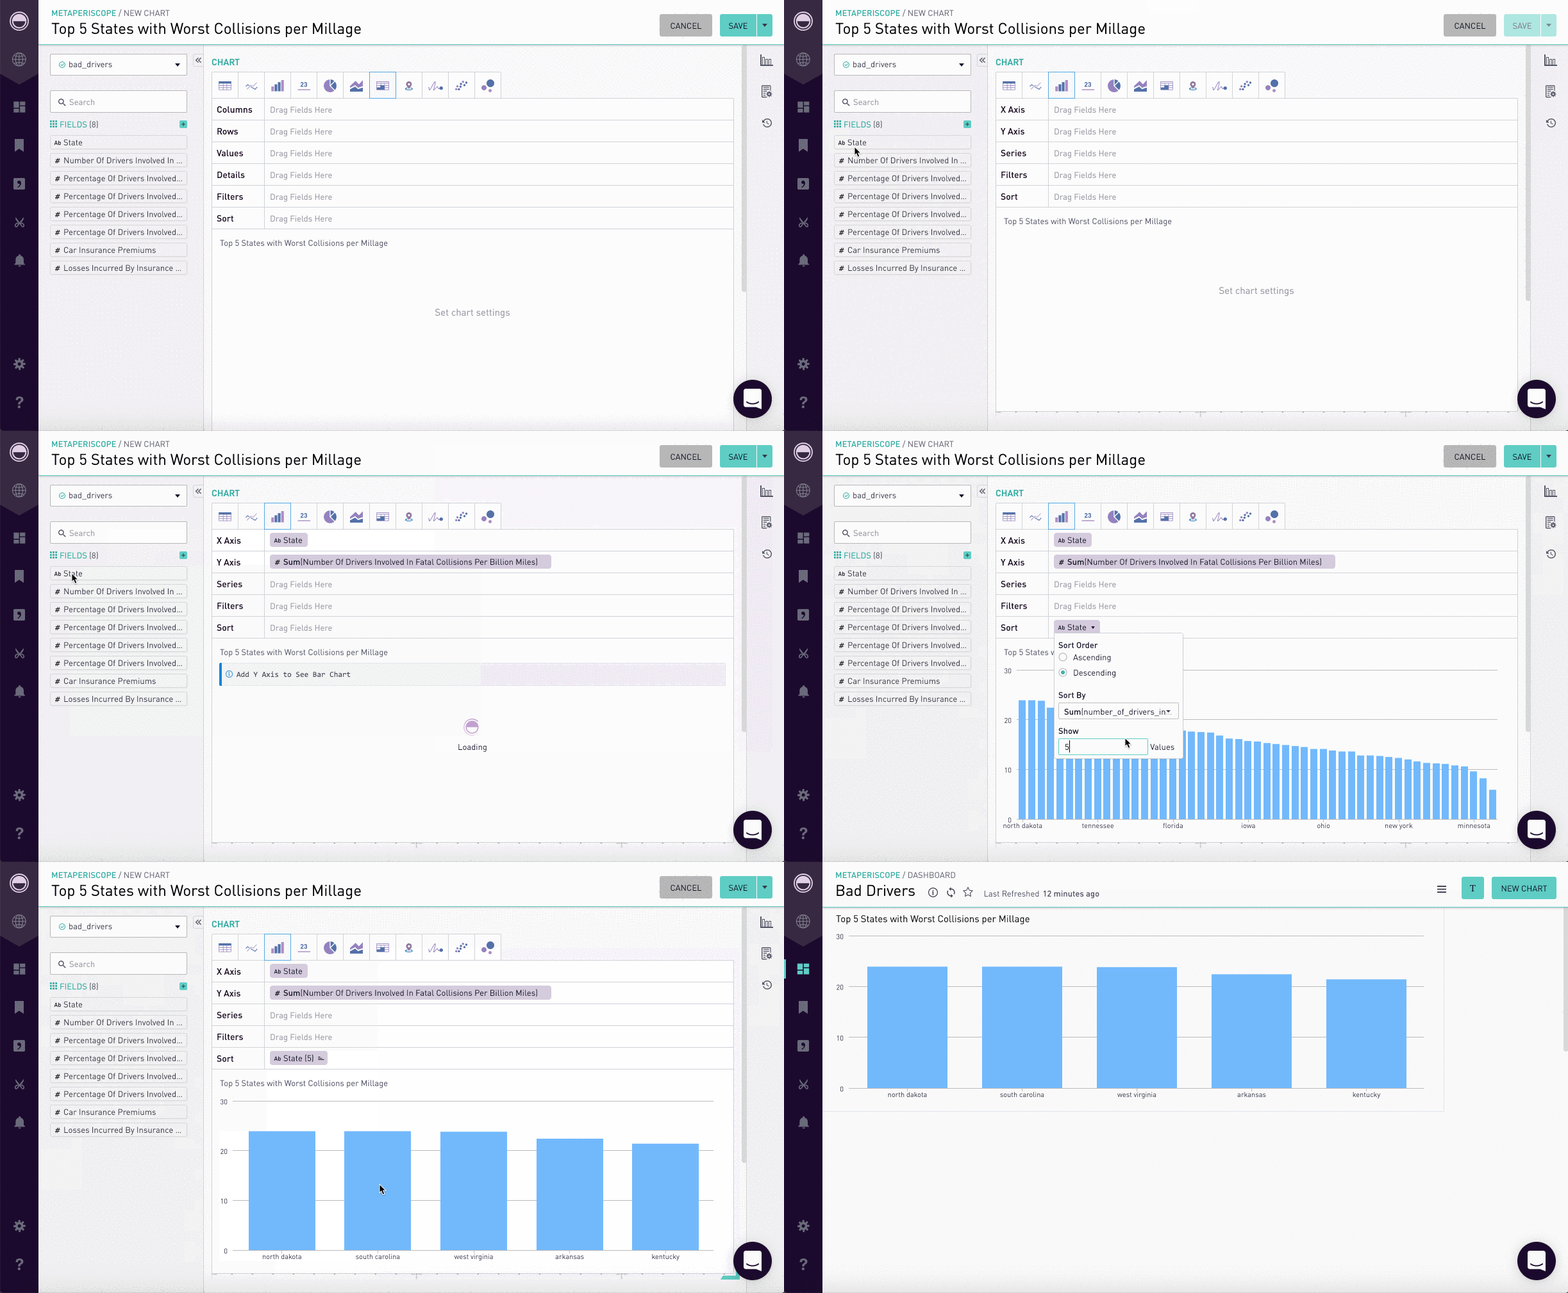
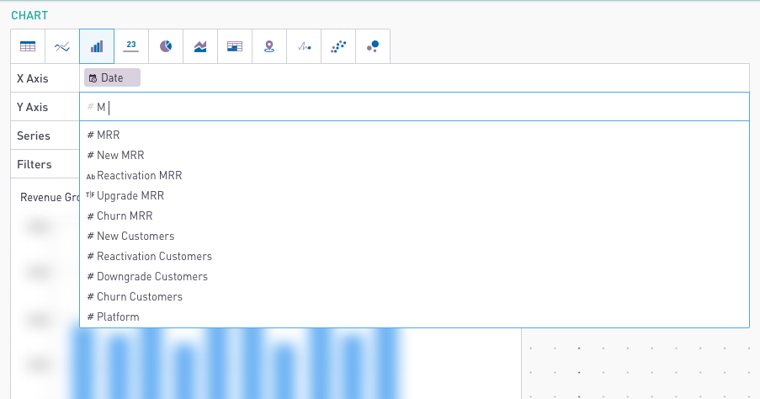
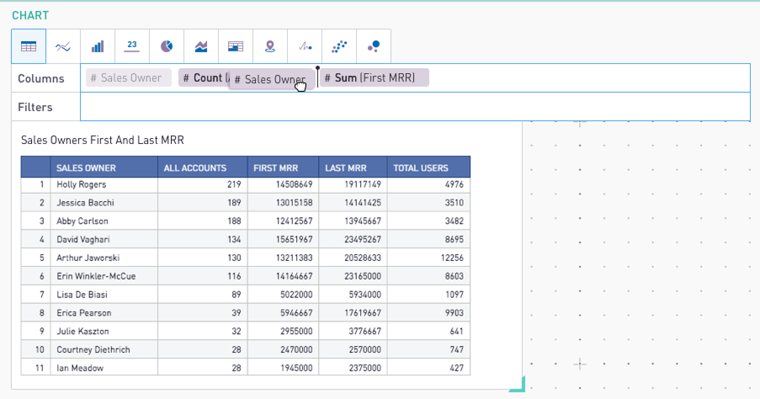
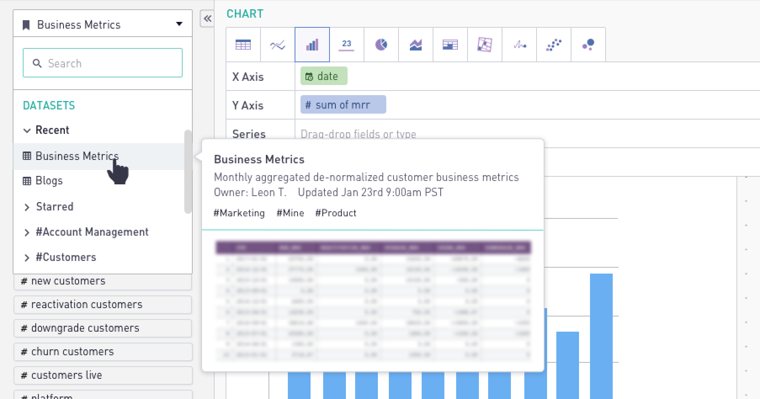
The central interaction was code-free analysis. I explored dragging into designated fields, typing into fields, and dropping a field onto a chart’s X and Y axes. Users preferred the last by far, but it was the hardest to build, so we scheduled it for a later release.
Internal testing and release
We released internally and gathered feedback in a Slack channel, plus a contest for the best dashboard. I worked with engineers to catch edge cases, and after launching as Data Discovery, the PM and I joined customer feedback calls.
Constraints
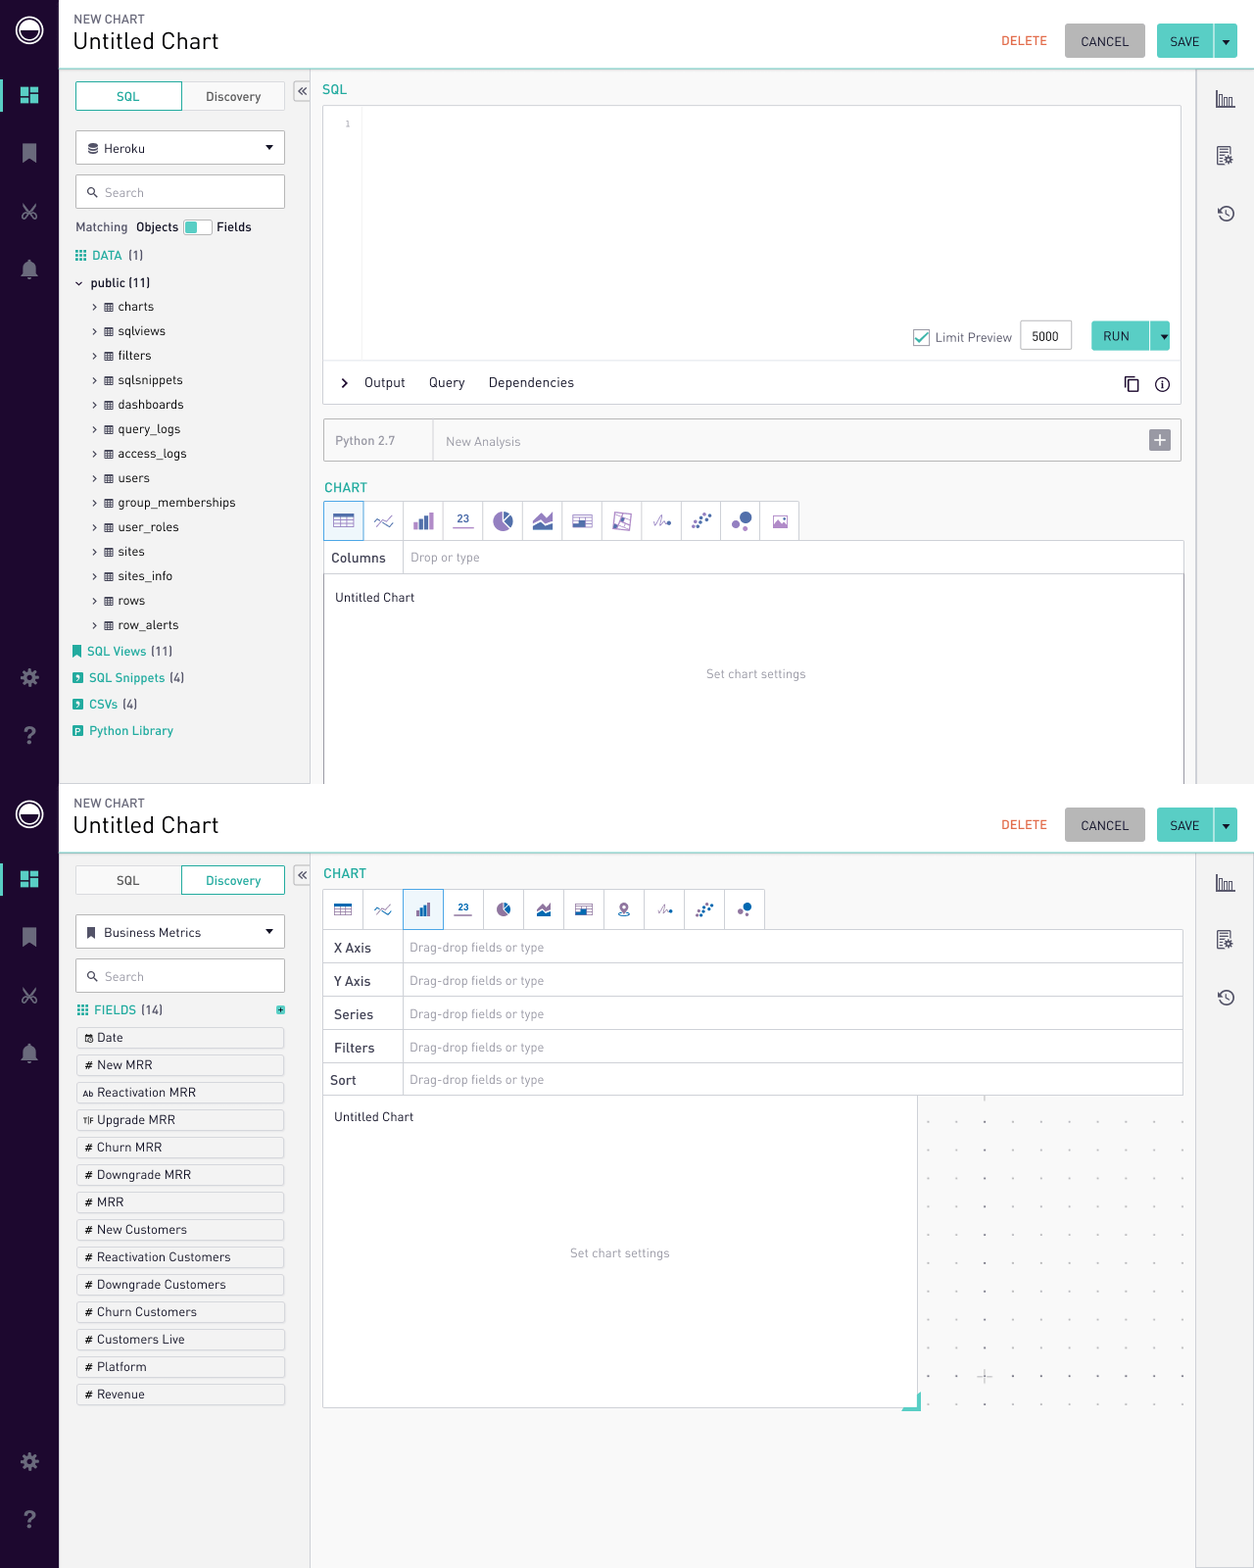
Business users’ experience had to remain accessible to analysts, so layout decisions followed the existing editor. Users preferred starting from the familiar new-chart flow on a dashboard, and since analysts needed both editors, we added a toggle above the schema tab.
Results
40%+
Most high-value accounts had Data Discovery enabled, and over 40% of those adopted the new workflows within six months. Sales reps also credited it with helping close renewals and new business.
Lessons and challenges
Discoverability
Prioritizing analysts’ path to query building meant compromising feature visibility. We planned to address this through information architecture work.
Work with an area expert
The PM’s analytics background helped us quickly define the persona, draft interview questions and use the right terminology.